Grades up for school finances
Published 10:09 am Friday, September 12, 2014
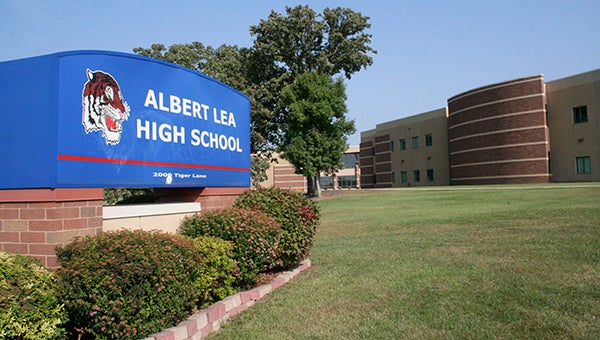
Construction of Albert Lea High School wrapped up in 2000 and its address is 2000 Tiger Lane. It is the newest school in the Albert Lea district. – Tim Engstrom/Albert Lea
Survey asks many questions besides divisive calendar issue
Almost 15 percent of Albert Leans gave Albert Lea Area Schools an A grade for financial management and about 36 percent gave it a B grade.
That’s up from 2007, when only 4 percent of Albert Leans gave the district an A grade in financial management, and about 17 percent gave it a B grade.
In early August, 303 Albert Leans got a phone call from Springsted Inc. with a survey that included questions about the proposed modified calendar for the 2015-2016 school year.
However, the survey was 35 questions long, and only a small portion of the questions in the survey were about the calendar. There were other questions asked to gather data about the Albert Lea School District for the school district.
About 42 percent of the survey takers were male and about 58 percent were female. About 11 percent of survey takers were between the ages of 25 and 34, about 13 percent were between the ages of 35 and 44, about 18 percent were between the ages of 45 and 54, about 17 percent were between the ages of 55 and 64 and about 42 percent were over age 65. Less than 1 percent of survey takers were between the ages of 18 to 24.

Mike Funk
About 79 percent of the survey takers were not parents and about 21 percent were parents.
Besides the calendar questions, survey takers were asked to grade the school district on a number of statements that the person giving the survey asked on an A-through-F grading scale.
Survey takers were asked about facility maintenance, safety and security, nonviolent environment, elementary education, middle school education, high school education, public information and financial management.
In all of these statements, the majority of survey takers gave the district an A or B grade, with a higher percentage of B grades than A grades in every instance except for the statement about safety and security and informing the public.
While the survey takers gave the district’s safety and nonviolent environment high percentages of A and B grades, Albert Lea Superintendent Mike Funk said he would always like to see those numbers higher. He stressed that he wants the entire community to feel their kids are safe when they go to school.
In most instances the A and B grades were close in percentage, but the middle school education had a wide gap: about 17 percent gave the district’s middle school education an A grade and about 47 percent gave it a B grade.
In a slightly smaller gap, about 22 percent of survey takers gave the district’s high school education an A grade while about 46 percent gave it a B grade.
Funk said these questions were good indicators that work needs to be done to answer the question of why these areas did not get as many A grades.
Internally, Funk said this information will be shared with staff to get feedback on what they think can be done. He also said there could be follow-up with the parent organizations in those buildings to get additional feedback.
When survey takers were asked about Albert Lea Area Schools’ financial management, about 15 percent gave it an A grade, about 36 percent gave it a B grade and about 24 percent gave it a C grade.
The C grade percentage is higher than other instances, but it is an improvement over the community’s opinion in 2007.
In 2007, Springsted Inc. surveyed the community as well in regard to an operating levy. When a similar question about financial management was asked during that survey, 4 percent gave the district an A grade, about 17 percent gave the district a B grade and about 47 percent gave the district a C grade.
Funk said it was nice to see the comparative data between 2007 and this year and that he was glad to see the percentages go up.
Look to the Tribune on Monday to read about more of the Springsted Inc. survey’s questions not relating to the calendar. Read the Sunday paper to read about the script asked of participants regarding the calendar.
Survey says …
Facility maintenance
A: 40.3 percent
B: 45.2 percent
C: 6.9 percent
D: 1 percent
F: .3 percent
Unable to evaluate: 6.3 percent
Safe and secure
A: 45.3 percent
B: 33.3 percent
C: 16 percent
D: 2 percent
F: 0 percent
Unable to evaluate: 3.3 percent
Nonviolent environment
A: 31.4 percent
B: 46.4 percent
C: 10.5 percent
D: 3.3 percent
F: 1.3 percent
Unable to evaluate: 7.2 percent
Elementary education
A: 28.7 percent
B: 45.2 percent
C: 14.2 percent
D: .7 percent
F: .3 percent
Unable to evaluate: 10.9 percent
Middle school education
A: 16.8 percent
B: 46.9 percent
C: 16.8 percent
D: 1 percent
F: .3 percent
Unable to evaluate: 18.2 percent
High school education
A: 21.5 percent
B: 45.5 percent
C: 15.2 percent
D: 2.3 percent
F: .3 percent
Unable to evaluate: 15.2 percent
Informing the public
A: 29 percent
B: 35.3 percent
C: 24.1 percent
D: 5.6 percent
F: 2.6 percent
Unable to evaluate: 3.3 percent
Financial management
A: 14.9 percent
B: 35.6 percent
C: 24.1 percent
D: 8.9 percent
F: 2.3 percent
Unable to evaluate: 14.2 percent
Financial management in 2007
A: 4 percent
B: 16.6 percent
C: 47.4 percent
D: 20.9 percent
F: 7.9 percent
Unable to evaluate: 3.3 percent
More Education


-
Construction Updates
-
-