What you need to know about Minnesota redistricting
Published 11:57 am Friday, February 11, 2022
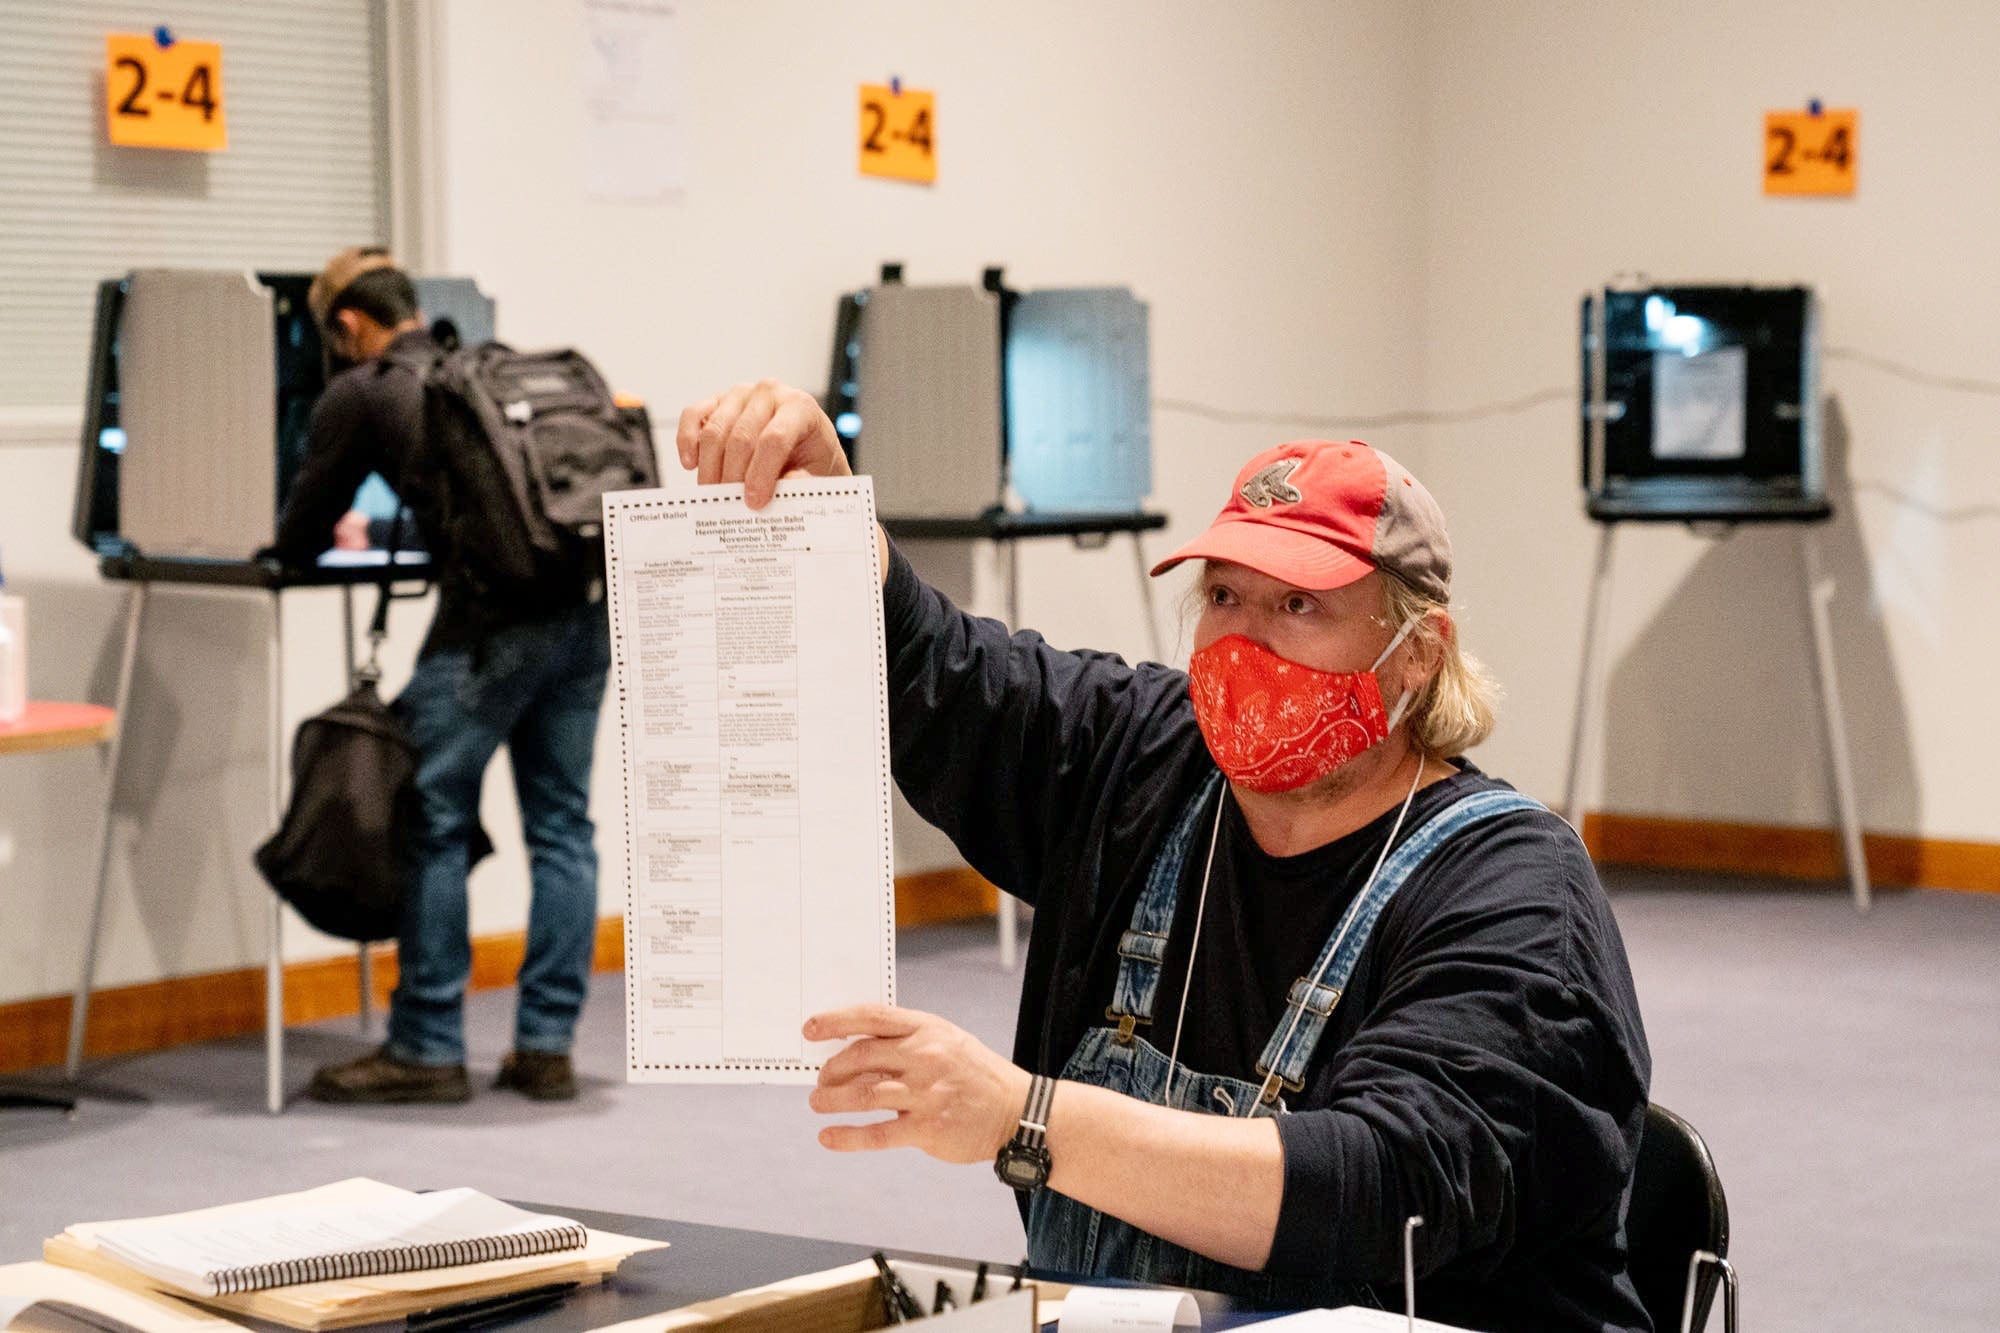
- Election Judge Andrew Goodell explains a ballot to a voter inside the Weisman Art Museum in Minneapolis on Nov. 3, 2020. Evan Frost/MPR News 2020
|
Getting your Trinity Audio player ready...
|
By David H. Montgomery, Minnesota Public Radio News
A panel of Minnesota judges will roll out new political maps, likely this coming Tuesday, that will shape Minnesota elections for the next decade.
The new maps could give edges to Democrats or Republicans in their battles for control of Congress or the state Legislature. They’ll give hundreds of thousands of Minnesotans new representatives — and give some representatives thousands of new voters. The new districts will reshape what parts of the state are politically competitive, and which communities have the voting weight to elect their own members into office.
Here’s what you need to know about redistricting in Minnesota — and also an interactive tool to see how redistricting will affect you.
Redistricting basics
The U.S. Congress and state legislatures elect members by splitting states up into smaller districts. Each of Minnesota’s eight congressional districts elects one member to the U.S. House of Representatives. Each of Minnesota’s 67 senate districts elects one member to the state Senate, and is divided into two House districts that each elects one member to the 134-person state House.
Every 10 years, states redraw their district maps to account for the past decade’s population change. Each district is supposed to have about the same number of residents, so districts that have grown quickly over the last decade need to shrink, while districts with less population growth need to expand.
Ordinarily, drawing new district maps is supposed to happen through the legislative process — both houses of the Legislature passing a bill, and the governor signing it. But control of Minnesota’s government is divided, with the Republicans who control the Senate and the Democrats who control the House and governor’s office unable to agree on maps.
This isn’t unusual for Minnesota, which has happened to be under divided government every redistricting year back to the 1960s. Instead, as happened after 2010, 2000, and other past censuses, Minnesota’s new maps will almost certainly end up being drawn by a panel of judges.
A five-person panel of judges is responsible for drawing the maps, unless the Legislature somehow passes a redistricting plan in the next few days: Judges Louise Bjorkman, Diane Bratvold, Jay Carlson, Juanita Freeman and Jodi Williamson.
The judges have said their maps will be guided by several principles:
Each district should contain equal numbers of residents, or as close as is possible.
Districts must be contiguous. This excludes boundaries that connect two different cities with a thin corridor of rural land in between them.
Districts can’t be drawn to infringe the voting rights of racial or ethnic minority groups, or to divide Native American reservations more than is necessary.
Political subdivisions like counties or cities should be preserved where possible.
So-called “communities of interest” should be kept together where possible. This means that areas that share similar “social, geographic, cultural, ethnic, economic, occupational, trade, transportation, or other interests” should be placed in a single district — rather than, say, districts that mix up parts of urban Minneapolis with rural farmland.
Districts should be as compact as possible.
Districts shouldn’t be drawn with the intention to promote or harm any party, or to promote or harm the interests of particular politicians. They won’t consider in either way where current officeholders live — either to prevent two incumbents from being drawn into the same district, or to intentionally do so. The judges rejected the idea that they should deliberately draw a map that reflects the state’s partisan balance, in favor of ignoring politics as a formal factor.
Seven different redistricting proposals
Besides the current map boundaries, Minnesota has seven formally proposed alternate maps. Three of those were produced by political party caucuses in the state Legislature:
The House DFL plan, also known as the Murphy plan after state Rep. Mary Murphy, DFL-Hermantown, was submitted by the DFL caucus in the state House of Representatives.
The House GOP plan, also known as the Torkelson plan after state Rep. Paul Torkelson, R-Hanska, was submitted by the GOP caucus in the state House.
The Senate GOP plan, also known as the Johnson plan after state Sen. Mark Johnson, R-East Grand Forks, was submitted by the GOP caucus in the state Senate. The Senate GOP plan and House GOP plan have identical congressional maps, but different maps for state legislative districts.
The three legislative plans were not formally submitted to the judges who will likely draw Minnesota’s final map.
Instead, the judges are considering four different redistricting proposals, submitted by different groups of citizens who intervened in the legal process:
The Wattson plan, named for election expert Peter Wattson, champions a “least-change” approach that modifies current districts as little as possible while meeting other criteria.
The Corrie plan, named for economist Bruce Corrie, is proposed by a coalition that wants to maximize the interests of communities of color.
The Anderson plan, named for Republican activist Paul Anderson, represents the interests of Minnesota Republicans.
The Sachs plan, named for retired educator Frank Sachs, represents the interests of Minnesota Democrats.
Political impact
The panel of judges may not be considering political factors when drawing their maps, but everyone else involved in the process is watching them intently (whether they admit it or not). Depending on how a map slices up the state’s population, it can contain more districts that lean to the Democrats or Republicans, or more districts that are closely divided.
These political impacts are likely to be relatively subtle in Minnesota — unlike some other states, where partisan legislators have drawn the maps:
New York’s new Democrat-drawn maps favor Democrats in 22 out of 26 seats, 85 percent of seats in a state where Joe Biden won just over 60 percent of the vote.
Ohio’s Republican-drawn maps — recently thrown out by that state’s courts — would have favored Republicans in 73 percent of seats in a state where Donald Trump won about 54 percent of the vote.
In contrast, almost all the proposed Minnesota plans create four DFL-leaning congressional districts and four Republican-leaning districts. The most extreme proposed legislative plan would give Democrats an advantage in about 57 percent of seats, only a little bit more than the 54 percent of the two-party vote that Biden won in 2020. These modest edges can make a big impact in a closely divided Legislature, but aren’t in the same ballpark as the extreme gerrymanders adopted by many other states.
Comparing the congressional proposals
The six different proposed Minnesota congressional maps — the House and Senate GOP plans have identical congressional plans — all have certain things in common. All more or less feature five districts in the Twin Cities metro area and three in greater Minnesota. They all feature a 5th District centered on Minneapolis, a 4th District centered on St. Paul, and an 8th District centered on the Iron Range. All put the 7th District in western Minnesota, the 1st District in southern Minnesota, the 2nd District in the southern suburbs, the 3rd District in the western suburbs, and the 6th District in the Twin Cities exurbs.
But behind those commonalities, the plans take very different approaches.
For example, the Torkelson, Wattson, Sach and Anderson plans keep the 8th District centered on northeastern Minnesota, with northwestern Minnesota part of the 7th District — aiming to separate the logging, mining and tourism economy of northeastern Minnesota from the farming economy of the northwest. But the Murphy and Corrie plans extend the 8th District all the way to the North Dakota border.
The Torkelson, Wattson and Anderson plans keep the 1st District running all the way across Minnesota’s southern border with Iowa. But the Sachs, Murphy and Corrie plans condense it to just the southeastern corner of the state, instead running it further north toward the Twin Cities.
Perhaps the most contentious district is the 2nd, which was the closest of Minnesota’s eight districts in the 2020 election. Currently it includes the metro area’s DFL-leaning southern suburbs along with a stretch of more Republican rural areas. Three of the plans, including the two DFL plans, cut off the 2nd District’s low-density rural areas and add in more dense suburbs — making it a safer district for incumbent Rep. Angie Craig, a Democrat. On the other extreme, the Torkelson/House GOP plan cuts out suburban areas in favor of more rural territory, thus giving it a Republican lean.
Overall, all the maps but one would have four districts that Joe Biden won in 2020 and four that Donald Trump won. That exception is the Torkelson plan, which would create five Republican-leaning districts by packing more Democratic voters into the three most urban districts.
Of course, the fact that Biden or Trump won a district in 2020 is no guarantee of how that district will shape out in 2022, or over the rest of the decade. Candidates for Congress or Legislature can sometimes run ahead of or behind the top of the ticket. The political climate can also change, leading significant numbers of voters to turn toward or away from a given political party. A district that one side won with 52 or 53 percent of the vote could easily flip back and forth, while a 70 percent district is almost always safe.
Meanwhile political realignments means that a safe district in one year might look very different 10 years later. In 2012, Democratic candidates won Minnesota’s three rural districts, and lost its three suburban districts. By 2020, this had flipped, with Democrats winning the suburban 2nd and 3rd districts, but losing the rural 1st, 7th and 8th — a reflection of a national political change that saw Republicans surge in rural areas and Democrats gain in suburbs.
This sort of change over 10 years is common enough that political watchers have coined a term to describe when it catches people by surprise. While a “gerrymander” is the standard term for a political map drawn for partisan gain, a “dummymander” is a gerrymander that backfires on the party that drew it due to changing political conditions.
Comparing the legislative proposals
The impacts could be bigger for control of the state Legislature, where Democrats currently control the House and Republicans control the Senate, both by narrow margins.
All seven of the maps would create more legislative districts where Biden won than Trump — not unusual given that Biden beat Trump by 7 percentage points here. But the precise boundaries that the judges adopt could create more districts that lean toward one party or the other. The most DFL-friendly of the proposed maps – unsurprisingly, the one from legislative Democrats — would create 78 Biden districts in the House, or 58 percent of the 134 seats. The most Republican-friendly map – made by legislative Republicans — would create just 71, or 53 percent.
This matters because ticket-splitting is more common in legislative races than it is in races for Congress. Republicans control the Minnesota Senate because in 2020 their candidates won seven districts where Biden beat Trump. If Republicans just have to win a couple of Biden districts, their path to a legislative majority is much simpler than if they have to win a dozen more.
And while all seven plans do create a majority of state House seats that Biden won, not even the most DFL-friendly map creates a majority of seats that Biden won comfortably. In all seven scenarios, a DFL House majority would rely on Democrats winning most of the seats that Biden won by a percentage point or two.
And if the political environment in 2022 is friendlier to Republicans than 2020 was, things change drastically.
For example, if the proposed maps are weighted not by 2020 vote share (when Biden won 53.6 percent of Minnesota’s two-party vote), but by 2016 vote share (when Democratic nominee Hillary Clinton won a bare 50.8 percent majority of the two-party vote), then suddenly all the proposed maps are either toss-ups or lean toward the Republicans.
The story is similar for the Minnesota Senate. Weighted against Biden’s 2020 win, all seven maps produce either a narrow DFL edge or a toss-up. (And Republicans actually won a Senate majority in 2020, despite Biden coming out on top in a majority of districts.)
Weighted against Clinton’s narrower 2016 vote share, however, even the Senate maps proposed by Democrats would give the GOP an advantage.
This situation, where a narrow DFL win in the statewide vote can produce legislative maps that lean to the Republicans, reflects how voters are distributed in Minnesota. Democratic strongholds in Minnesota, such as Minneapolis and St. Paul, tend to give 80 to 90 percent of their votes to Democrats. The most Republican parts of the state, by contrast, give Republican candidates 70 to 75 percent. Because only 50 percent plus one is needed to win, those extra votes are in a sense wasted.
That means Democrats can pile up big statewide majorities that don’t translate into majorities of districts, because their statewide margin of victory is coming from safe seats in the metro.
One way of measuring that is called the “efficiency gap,” a comparison of each party’s wasted votes. In a perfectly balanced map, these might cancel out. In practice, Minnesota’s current districts and all proposed alternatives all feature more wasted votes by Democrats — or rather, an “efficiency gap” in favor of the Republicans. That’s because of the increased concentration of Democrats in DFL strongholds.
Most of the legislative redistricting proposals produce maps where Minnesota Democrats have more wasted votes than Republicans. The sole exception, by MPR News’ calculation, was the redistricting plan drawn up for the state House by the House DFL, which managed to produce a very minor lean to Democrats. All the maps for the Senate had a moderate skew in favor of Republicans, to a greater degree than the House did, but all below the 7 or 8 percent threshold that some experts view as concerning.
How would you be redistricted?
No one knows what maps the judges will unveil next week. But the result will mean changes for hundreds of thousands of Minnesotans, at a minimum. Even the proposed plan with the most minimal changes would move some 229,000 Minnesotans to a different congressional district, while the most aggressive plans would move nearly 1.3 million people around. And all seven of the plans would put a majority of Minnesotans into new legislative districts.
So MPR News created an interactive tool to let you see how you’d be impacted by different redistricting plans. Just type in your address into the form and click “Go!”
More News


-
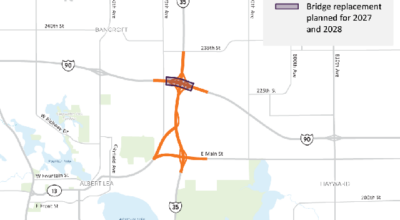
Construction Updates
-
-